Aayush Gadia

MSIS Graduate Student @ UMD Smith, College Park
Ex- Software Engineer @ Avoma
Know More-
Google Scholar . GitHub . HackerRank
Get In Touch-
LinkedIn . Email . AngelList
README- Searching-Repeating-Pattern
BRIEF DESCRIPTION:
-
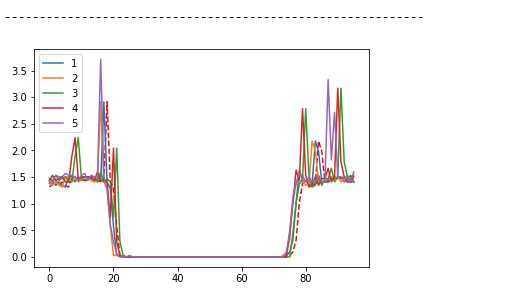
Basically we have datasets containing Timestamp & corresponding Energy Values. On generating the Visual Plot of the dataset with Timestamp on the X Axis & Energy Values on the Y Axis we get a Pattern. Our goal was to select any 2 particular Timestamp viz in the dataset, between these Timestamp’s we have a Pattern enclosed and the Script will basically search for all the Timestamp Range which encloses similar pattern (any Timestamp Range will consist of 2 values: starting timestamp & ending timestamp).
-
The Script also computes the Accuracy percentage of each Possible Timestamp Range, with each Timestamp Range enclosing a pattern similar to the selected one. Lets say for a particular Timestamp Range, the accuracy percentage for the pattern enclosed is 65%, then this actually means that the pattern is 65% similar to the pattern generated by selected Timestamp Range which was entered by user.
-
The Script tells about the following:
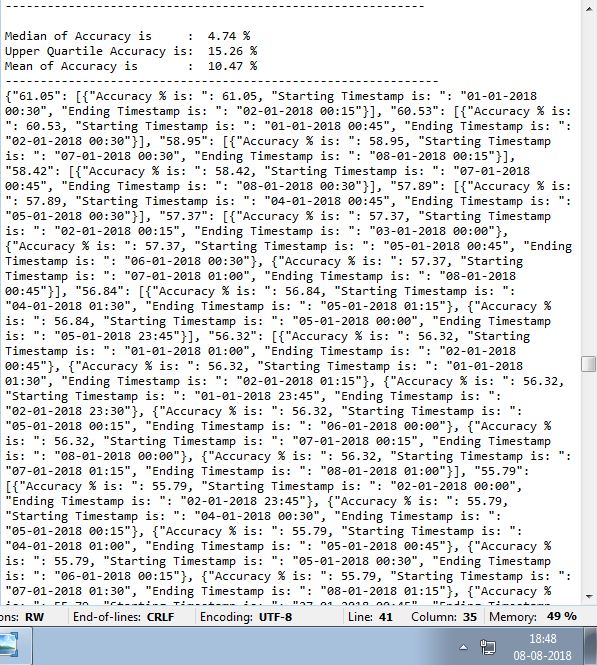
1. Accuracy Insights :: it represents the Mean , Upper Quartile & Median of Accuracy Values.
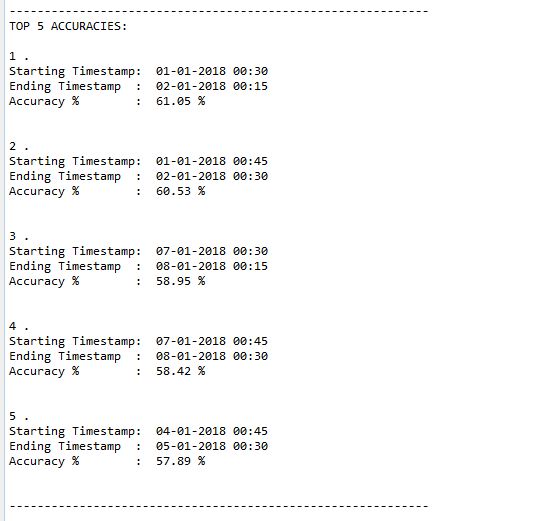
2. Top 5 Accuracies :: it represents the Top 5 Accuracy Percentages among all the Accuracy values along with their respective Timestamp Range.
3. Average Value :: it represents basically the Average. Top 5 Accuracies has several timestamp’s ranges and within each range their are timestamp’s at which value is recorded; so basically we are computing the average of the recorded values at each timestamp of different timestamp’s ranges which are coming in the Top 5 Accuracies.
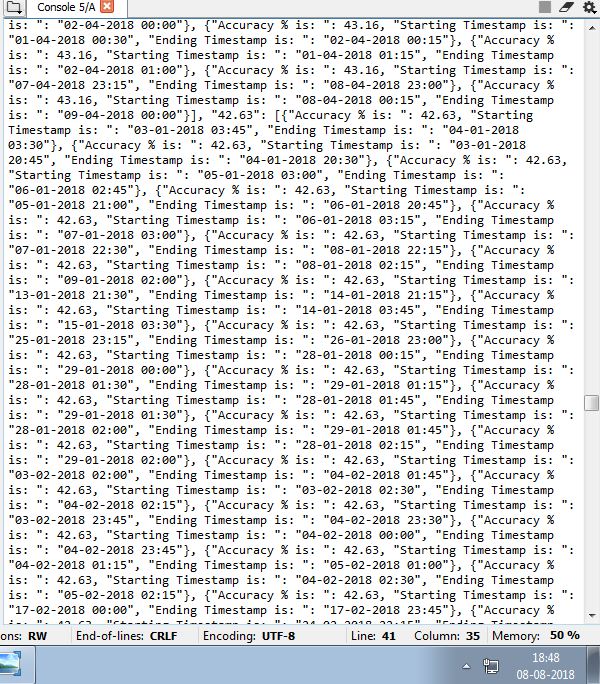
4. All Accuracies :: it represents All the Unique Accuracy Values sorted in Descending Order with each Unique Accuracy representing all the Timestamp Range where the same percentage of Accuracy exists.
NOTE :: It may happen that one particular accuracy percentage exists in more than 1 particular Timestamp Range.
NOTE:: All the above Outputs are passed by the Script in JSON.
PREREQUISITES:
- written for LINUX Server.
- written in Python 3.6 .
- supporting packages required- pandas, numpy, statistics, json & sys.
CLIENT-END FULFILMENTS:
The below format must be followed for the successful running of the script:
- File Path ::
- it must be a CSV File Path.
- it must be passed in the second argument of sys.argv.
- Input String ::
- it must be passed in the third argument of sys.argv.
- it must be passed as as JSON String.
-
the JSON String, alternatively the dictionary data structure should have the following Key Names::
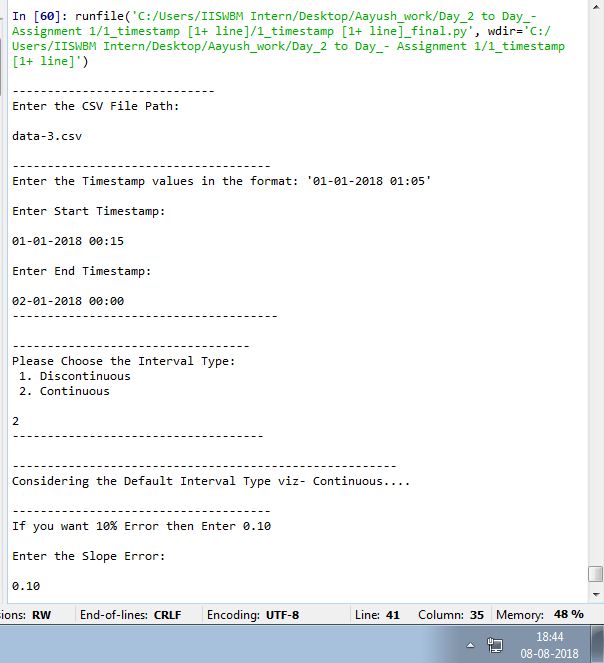
a. start_timestamp :: should be in format- "DD-MM-YYYY HRS:MINUTES", eg. 05-01-2018 00:15
b. end_timestamp :: should be in format- "DD-MM-YYYY HRS:MINUTES", eg. 05-01-2018 00:15
c. graph_type :: should be either 1, 2 or 3. [1. for Continuous Output, 2. for Discontinuous Output & 3. for Average of Timestamp's Output]
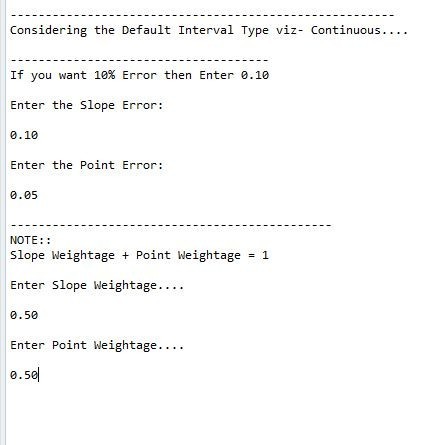
d. slope_error :: if 15% error then value of slope_error should be 0.15
e. point_error :: if 15% error then value of point_error should be 0.15
f. slope_weightage :: slope_weightage + point_weightage = 1
g. point_weightage :: slope_weightage + point_weightage = 1
h. output_type :: should be either 1, 2 or 3. [1. for Accuracy Insights, 2. for for Top 5 Accuracy & 3. for All Accuracies]CAUTION: The above Key Names are case-sensitive, so use exactly as written above.
- Output String ::
- it is passed as a JSON String.
- basically the Output is User Choice Dependent. The User is given Choice of Selecting the Output Type.
- On selecting the Output Type as 1 , the User gets to see the Accuracy_Insights; irrespective of the Graph_Type.
- On selecting the Output Type as 2 and Graph_Type as any but != 3, the User gets to see the Top 5 Accuracy with no Average Value. Here simply a dictionary of Top 5 Accuracy is returned. Top 5 Accuracy also contains the Timestamp Ranges.
- On selecting the Output Type as 2 and Graph_Type as 3, the User gets to see the Top 5 Accuracy along with the Average Value.Both the values are passed into a list. So basically a List is returned with first index containing Top 5 Accuracy & second index containing Average Value. Top 5 Accuracy also contains the Timestamp Ranges.
- On selecting the Output Type as 3, the User gets to see all the Accuracies with their Timestamp Ranges; irrespective of Graph_Type.
OUTPUT SAMPLE:
-
Actual Data Graph: data-3

-
Input-
-
Overall Output-
-
Top 5 Accuracies-
AUTHORS:
- coded by AAYUSH GADIA.