Aayush Gadia

MSIS Graduate Student @ UMD Smith, College Park
Ex- Software Engineer @ Avoma
Know More-
Google Scholar . GitHub . HackerRank
Get In Touch-
LinkedIn . Email . AngelList
README- Pattern-Recognition-with-Insights
BRIEF DESCRIPTION:
-
Basically, when we have large datasets lets say of 6 months or more and we want to know about the dataset like knowing how the dataset behaves in both qualitative as well as quantitative ways then our program comes into picture.
-
This program when given a dataset, automatically profiles the dataset into weekdays and tells about the No. of Cycles, the Total Energy Consumption, Total Duration when Cycle was Active, Cycle Start & End Time, Cycle Energy Peak Values- both Maximum & Minimum.
-
The program gives an Overview of the whole Dataset in the form of Data Stories which summarises the entire output in weekdays & also gives detailed information in the form of Insights which tells about each and every aspect of the dataset in a detailed manner on the parameters written in the above para.
-
Basically here the program automatically computes the Off-Values, which are nothing but values on the Y Axis, and with these Off-Values we cut our entire plot horizontally so the insights as well as data stories comes in 2-3 variations (if 2 off-values then 2, if 3 off-values then 3), with one each for each off-value.
-
Here we are running the program on a day to day basis and calculating the no. of cycles and all.
-
This program is very much helpful when it comes to knowing the entire year’s data that too quantitatively because by Excel we get a qualitative idea but this program gives a quantitative idea, thereby validating our perception.
-
The Script tells about the following:
- cycles_profile :: it represents the unique different no. of cycles that is found on different days in dataset for each off-value.
- top_3_profile :: tells about the top_3 cycles profile which has maximum no. of days in it, for each off-value.
- total_days_in_dataset :: tells about the no. of days in the dataset.
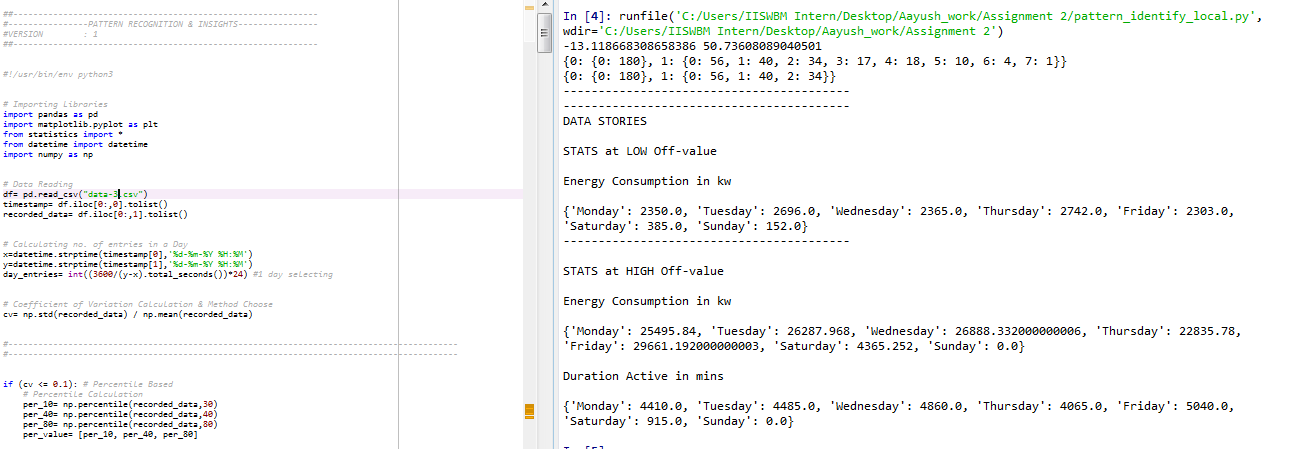
- data_stories :: gives an overview of the entire dataset, for each off-value, telling about the total energy consumption (in kw) & total active duration (in mins) for different weekdays, for each off-value.
- insights ::
- gives the detailed insights of the entire dataset, for each off- value telling about the information like Cycle Average Energy Consumption (in kw), Cycle Energy Peak Values (both Max & Min) (in kw), Cycle General Start & End Time, Cycle Average & Median Duration (in mins) for diff weekdays, for each off-value.
- If there are zero cycles then it also tells whether these are exact zero or adultered zero and also tells the following insights written above.
NOTE:: All the above Outputs are passed by the Script in JSON.
PREREQUISITES:
- written for LINUX Server.
- written in Python 3.6 .
- supporting packages required- pandas, numpy, statistics, datetime, json & sys.
CLIENT-END FULFILMENTS:
The below format must be followed for the successful running of the script:
- File Path ::
- it must be a CSV File Path.
- it must be passed in the second argument of sys.argv.
- CSV File Data ::
-
Make sure that the 1st Column is Timestamps Data.
NOTE :: Timestamps should have Date portion starting with Day. -
2nd Column must have Energy Data in kw.
-
- Input String ::
- NO INPUT PASSED.
- Output String ::
- it is passed as a JSON String.
- Data Stories as well as Insights, both are passed in the Output
OUTPUT SAMPLE:
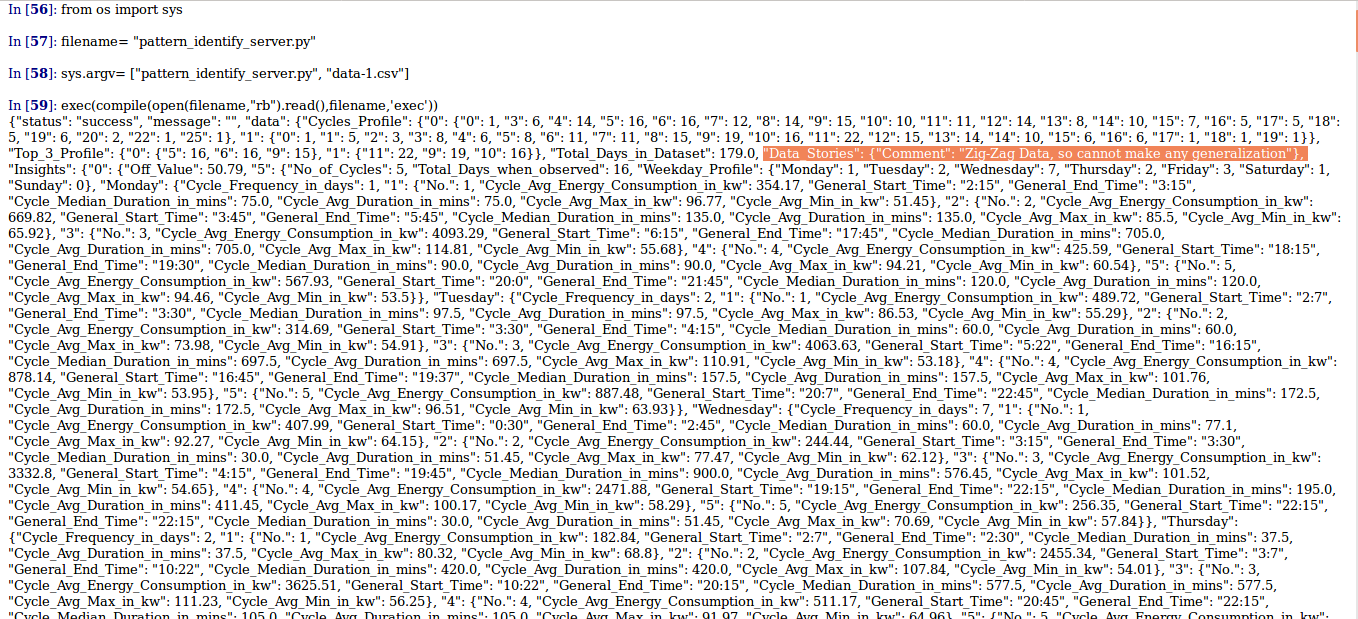
- data-1


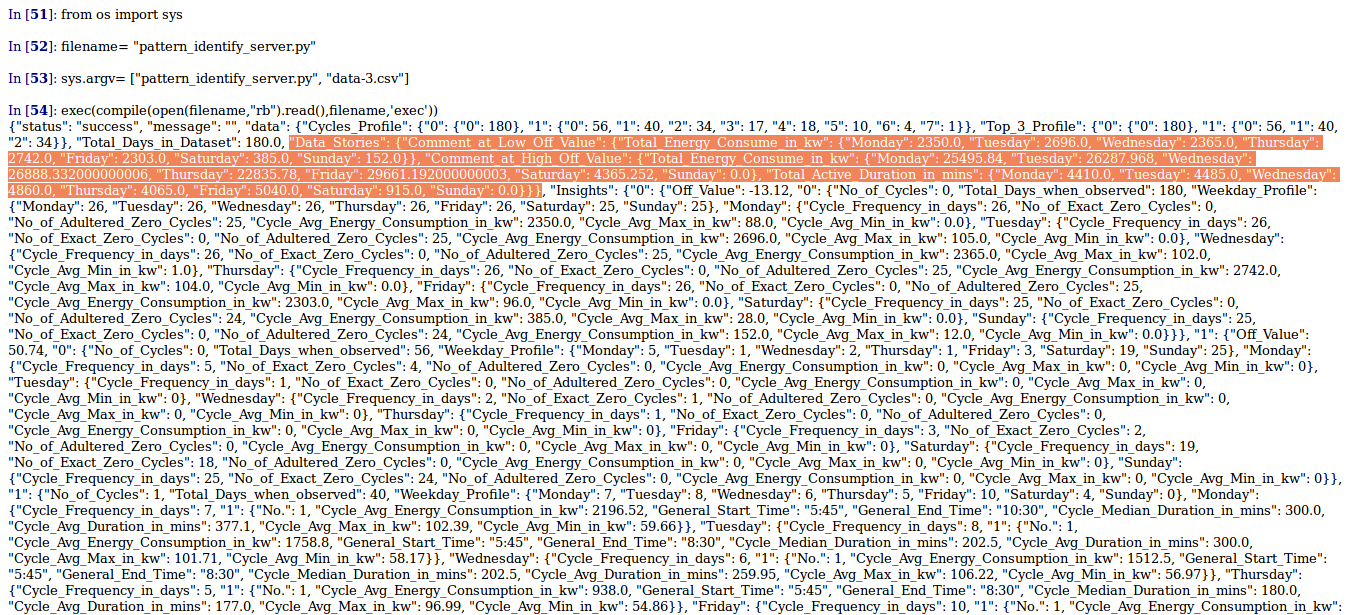
- data-2


AUTHORS:
- coded by AAYUSH GADIA.